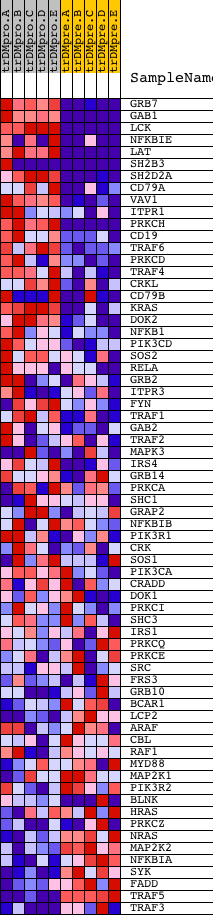
Profile of the Running ES Score & Positions of GeneSet Members on the Rank Ordered List
| Dataset | Set_04_transDMproB_versus_transDMpreB.phenotype_transDMproB_versus_transDMpreB.cls #transDMproB_versus_transDMpreB.phenotype_transDMproB_versus_transDMpreB.cls #transDMproB_versus_transDMpreB_repos |
| Phenotype | phenotype_transDMproB_versus_transDMpreB.cls#transDMproB_versus_transDMpreB_repos |
| Upregulated in class | transDMproB |
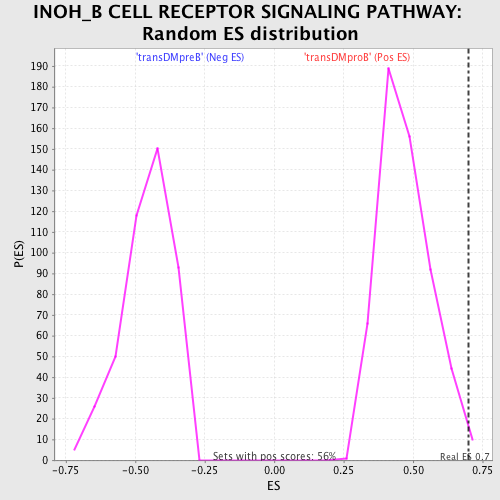
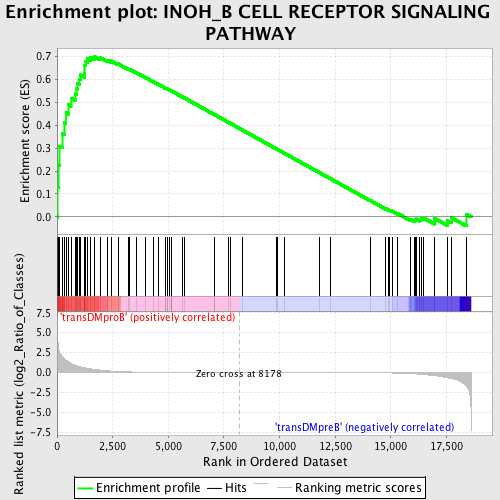
| GeneSet | INOH_B CELL RECEPTOR SIGNALING PATHWAY |
| Enrichment Score (ES) | 0.69819975 |
| Normalized Enrichment Score (NES) | 1.4848429 |
| Nominal p-value | 0.010752688 |
| FDR q-value | 0.273331 |
| FWER p-Value | 0.99 |
| PROBE | DESCRIPTION (from dataset) | GENE SYMBOL | GENE_TITLE | RANK IN GENE LIST | RANK METRIC SCORE | RUNNING ES | CORE ENRICHMENT | |
|---|---|---|---|---|---|---|---|---|
| 1 | GRB7 | 20673 | 25 | 4.169 | 0.1284 | Yes | ||
| 2 | GAB1 | 18828 | 58 | 3.226 | 0.2272 | Yes | ||
| 3 | LCK | 15746 | 101 | 2.651 | 0.3074 | Yes | ||
| 4 | NFKBIE | 23225 1556 | 225 | 2.015 | 0.3635 | Yes | ||
| 5 | LAT | 17643 | 323 | 1.671 | 0.4103 | Yes | ||
| 6 | SH2B3 | 5001 16383 | 399 | 1.545 | 0.4544 | Yes | ||
| 7 | SH2D2A | 6569 | 506 | 1.325 | 0.4899 | Yes | ||
| 8 | CD79A | 18342 | 625 | 1.113 | 0.5182 | Yes | ||
| 9 | VAV1 | 23173 | 813 | 0.905 | 0.5363 | Yes | ||
| 10 | ITPR1 | 17341 | 884 | 0.841 | 0.5587 | Yes | ||
| 11 | PRKCH | 21246 | 909 | 0.818 | 0.5829 | Yes | ||
| 12 | CD19 | 17640 | 1000 | 0.729 | 0.6008 | Yes | ||
| 13 | TRAF6 | 5797 14940 | 1054 | 0.682 | 0.6191 | Yes | ||
| 14 | PRKCD | 21897 | 1237 | 0.576 | 0.6273 | Yes | ||
| 15 | TRAF4 | 10217 5796 1400 | 1244 | 0.572 | 0.6448 | Yes | ||
| 16 | CRKL | 4560 | 1245 | 0.572 | 0.6626 | Yes | ||
| 17 | CD79B | 20185 1309 | 1283 | 0.553 | 0.6778 | Yes | ||
| 18 | KRAS | 9247 | 1356 | 0.521 | 0.6901 | Yes | ||
| 19 | DOK2 | 354 | 1495 | 0.462 | 0.6971 | Yes | ||
| 20 | NFKB1 | 15160 | 1695 | 0.381 | 0.6982 | Yes | ||
| 21 | PIK3CD | 9563 | 1930 | 0.306 | 0.6951 | No | ||
| 22 | SOS2 | 21049 | 2262 | 0.214 | 0.6839 | No | ||
| 23 | RELA | 23783 | 2432 | 0.175 | 0.6803 | No | ||
| 24 | GRB2 | 20149 | 2736 | 0.123 | 0.6678 | No | ||
| 25 | ITPR3 | 9195 | 3225 | 0.069 | 0.6436 | No | ||
| 26 | FYN | 3375 3395 20052 | 3271 | 0.066 | 0.6433 | No | ||
| 27 | TRAF1 | 14611 | 3548 | 0.047 | 0.6298 | No | ||
| 28 | GAB2 | 1821 18184 2025 | 3992 | 0.029 | 0.6069 | No | ||
| 29 | TRAF2 | 14657 | 4330 | 0.020 | 0.5893 | No | ||
| 30 | MAPK3 | 6458 11170 | 4552 | 0.016 | 0.5779 | No | ||
| 31 | IRS4 | 9183 4926 | 4849 | 0.013 | 0.5624 | No | ||
| 32 | GRB14 | 14574 2719 | 4881 | 0.013 | 0.5611 | No | ||
| 33 | PRKCA | 20174 | 4949 | 0.012 | 0.5579 | No | ||
| 34 | SHC1 | 9813 9812 5430 | 4950 | 0.012 | 0.5582 | No | ||
| 35 | GRAP2 | 5113 9398 | 5061 | 0.011 | 0.5527 | No | ||
| 36 | NFKBIB | 17906 | 5120 | 0.011 | 0.5499 | No | ||
| 37 | PIK3R1 | 3170 | 5127 | 0.011 | 0.5499 | No | ||
| 38 | CRK | 4559 1249 | 5134 | 0.011 | 0.5499 | No | ||
| 39 | SOS1 | 5476 | 5657 | 0.008 | 0.5220 | No | ||
| 40 | PIK3CA | 9562 | 5742 | 0.007 | 0.5177 | No | ||
| 41 | CRADD | 19640 | 7051 | 0.003 | 0.4473 | No | ||
| 42 | DOK1 | 17104 1018 1177 | 7086 | 0.003 | 0.4455 | No | ||
| 43 | PRKCI | 9576 | 7683 | 0.001 | 0.4134 | No | ||
| 44 | SHC3 | 21465 | 7798 | 0.001 | 0.4073 | No | ||
| 45 | IRS1 | 4925 | 8350 | -0.000 | 0.3776 | No | ||
| 46 | PRKCQ | 2873 2831 | 9877 | -0.004 | 0.2955 | No | ||
| 47 | PRKCE | 9575 | 9884 | -0.004 | 0.2953 | No | ||
| 48 | SRC | 5507 | 10223 | -0.005 | 0.2772 | No | ||
| 49 | FRS3 | 23209 | 11779 | -0.010 | 0.1937 | No | ||
| 50 | GRB10 | 4799 | 12283 | -0.013 | 0.1670 | No | ||
| 51 | BCAR1 | 18741 | 14082 | -0.032 | 0.0710 | No | ||
| 52 | LCP2 | 4988 9268 | 14777 | -0.050 | 0.0352 | No | ||
| 53 | ARAF | 24367 | 14892 | -0.055 | 0.0308 | No | ||
| 54 | CBL | 19154 | 14950 | -0.058 | 0.0295 | No | ||
| 55 | RAF1 | 17035 | 15064 | -0.065 | 0.0254 | No | ||
| 56 | MYD88 | 18970 | 15312 | -0.080 | 0.0146 | No | ||
| 57 | MAP2K1 | 19082 | 15878 | -0.140 | -0.0115 | No | ||
| 58 | PIK3R2 | 18850 | 16073 | -0.170 | -0.0167 | No | ||
| 59 | BLNK | 23681 3691 | 16089 | -0.175 | -0.0121 | No | ||
| 60 | HRAS | 4868 | 16140 | -0.184 | -0.0091 | No | ||
| 61 | PRKCZ | 5260 | 16309 | -0.219 | -0.0113 | No | ||
| 62 | NRAS | 5191 | 16367 | -0.233 | -0.0071 | No | ||
| 63 | MAP2K2 | 19933 | 16484 | -0.264 | -0.0051 | No | ||
| 64 | NFKBIA | 21065 | 16968 | -0.396 | -0.0188 | No | ||
| 65 | SYK | 21636 | 16978 | -0.400 | -0.0069 | No | ||
| 66 | FADD | 17536 8950 4711 | 17535 | -0.648 | -0.0167 | No | ||
| 67 | TRAF5 | 13718 | 17717 | -0.750 | -0.0031 | No | ||
| 68 | TRAF3 | 21147 | 18395 | -1.654 | 0.0119 | No |